

The Margin Pricing Strategy for HVAC Profit Margins
Healthy profit margins are essential for field service business viability, but they remain elusive. HVAC businesses average a puny 8% net profit margin, and some leading HVAC industry consultants say the top five percent of operators account for about 95% of all profits in the industry.
That means the other 95% of businesses are left fighting over the remaining five percent of profits that spill out of the other guys’ pockets on their way to the bank. The HVAC numbers are similar for plumbing, electrical, garage door, and other field service vertical markets.
There are an estimated 105,000 HVAC companies in the US today, so only 5,000 companies are making solid profits. Why should that be if every business owner wants to be profitable? Having the want-to and knowing the how-to are two different things.

The Purpose of Profit
Management guru Peter Drucker adamantly said the primary responsibility of a company is to serve its customers, not make a profit. Drucker added that without profits, a business cannot serve its customers or sustain itself. He expressed it this way:
“Profit is not the purpose of a business, but rather the test of its validity.”
In plain language, if you don’t have profits, you don’t have a business, you have a job. Profit must be baked into your thinking and your processes. Aim to make each transaction, each service call, profitable so you can continue to serve your customers.
Customers want to be served. They are willing to pay a premium for outstanding service. Customers can get the products you sell from competitors, but they can’t get you. Beat the competition by delivering a fantastic customer experience your competition will be hard-pressed to match. That is the key to profitability and growth.
Business Knowledge Essential
Consultant after consultant in the HVAC industry says the reason for the astonishing 95% business mediocrity rate is that most HVAC owners and managers simply don’t know enough about business fundamentals.

Setting prices that are fair to customers and owners alike is essential. If prices are too high, you will not be competitive. If you set prices too low to “win” more jobs, you will either be treading water or slowly going broke.
NOTE: Don’t fall into the low-price, high-volume trap. There is always someone willing to take a bigger loss than you to get some quick cash, but that is short-sighted. Don’t concede your right to make a fair profit.
Tracking the Right Key Performance Indicators
Sera™ field service software enables businesses to track dozens of key performance indicators minute-by-minute with live data.
Most customers track critical KPIs at all times, including revenue, gross margin, net margin, cash flow, tech efficiency, labor expense, membership sales, customer retention, and marketing ROI. They use other KPIs as their business needs may require. Invariably, financial KPIs head the list.
Financial Fundamentals
Every small business owner should know how to read and use information from balance sheets and profit & loss statements.
The balance sheet provides a picture of a company’s overall financial position and what the owner’s investment is worth at a given point in time. The formula is:
Owner’s Equity = Total Assets – Total Liabilities
This is calculated by adding all assets, including cash, accounts receivable, inventory, physical property, and equipment less depreciation and then subtracting the total of accounts payable, accrued liabilities, short-term notes payable, and long-term debt.
The obvious goal is to keep this number growing each year. We will discuss the balance sheet in more detail in a separate article. Right now, let’s zoom in on the P&L statement because when you master it you are on your way to better profitability.
 The profit & loss statement tells how much a business has earned in a given period, typically one month or one year. This also is called P&L, Income Statement, Income and Expense Statement, and Statement of Financial Results.
The P&L statement is a goldmine of information, including gross and net income, cash flow, and earnings.
We built Sera’s field service software on a pricing model focused on up-to-the-minute profit & loss information. Business owners get detailed financial performance data needed to make informed business decisions – including setting profitable prices. It’s a total, integrated business solution, not simply a digital filing cabinet.
It may be tempting to leave financial details to your accountant, but this data is vital to planning and tracking your success. Serving customers is the goal and profitability is the objective, so let’s look at some definitions and the relationship between gross and net profit.
Some of this will be a review for some readers, so scan down the page as you like.
Profit Margins
Gross profit and net profit can be as different as lightning and lightning bugs. The difference lies in knowing what all your actual costs and expenses are, how you account for them, and how you control them.
Here’s a quick review of terminology:
Gross Profit – total revenue minus all material and labor expenses related to producing and delivering goods and services, but not including sales, general, and administrative costs. This is important because it shows your ability to cover the cost of running your business. The greater the gross margin the healthier the cash flow needed for growth and expansion.
Gross Profit Margin – gross profit divided by net sales (gross sales minus returns, allowances, and discounts). The HVAC industry average for gross profit margins is 30% – 40%. You should go no lower than 45% but preferably be in the 50 to 60 percent range to get your net profit margin above the 8% industry average.
Gross Profit Margin = Gross Profit ÷ Revenues X 100
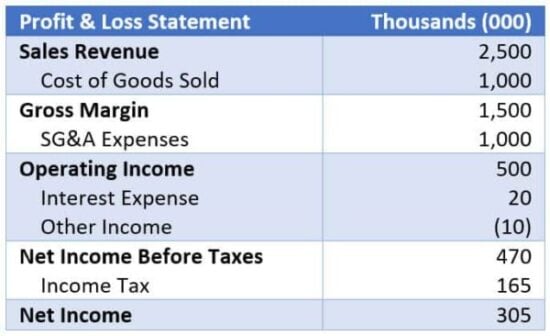
Using the abbreviated P&L statement above to calculate the gross profit margin we get:
Gross Profit Margin = 1500 ÷ 2500 = 0.6 X 100 = 60%
Net Profit – also called net income, this is the “bottom line” number derived by subtracting all expenses from gross revenues, including the cost of goods and services sold, SG&A expenses, interest expense, other income, and taxes.
Net Profit Margin – this is net income/net profit divided by gross revenues. The average net profit margin for HVAC companies is about 8%. With good gross margins in the 50-60 percent range and rigorous cost control, you can realistically aim for a net profit margin of two or three times the industry average.
Net Profit Margin = Net Income ÷ Gross Revenues X 100
Using the values in the abbreviated P&L statement above to solve for net profit margin:
Net Profit Margin = 305 ÷ 2500 = 0.122 X 100 = 12.2%
While this net profit margin beats the industry average of 8% it could be far better by reducing SG&A expenses. Business automation is an excellent way to do this. Knowing all your costs is essential to achieving healthy profit margins. That includes labor costs by department, product and parts costs, utilities, insurance, rent, equipment, fuel, marketing, and all other costs of doing business.

See how Sera’s Automated Dispatching Software Works with our Smart Scheduler, Tech App, Admin Portal, and Customer Hub to streamline your business and grow your bottom line fast!
REQUEST PERSONAL DEMONSTRATIONUse Margin Pricing for Profitability
For the past couple of decades, the running debate about pricing in the field service industry has been whether to price based on time and material or flat rates. Customers prefer flat rates because they know the cost upfront, while with hourly pricing they do not.
Using either method requires figuring out what to charge for parts and new equipment and what to charge for labor. Most operators mark up the wholesale prices they pay by a percentage ranging from 25 – 100 percent markup.
We don’t recommend either method. You can have the best of both worlds – price protection for you and your customers – with what we call margin pricing. Google the term and you will get a lot of results for “price margins” instead of “margin pricing” but the principle is the same.
Margin pricing is a pricing strategy that starts with determining your desired net profit margin and working backward from there to set prices. Sera field service software also boosts operating efficiency by automating repetitive tasks, including scheduling and dispatching. Then, add strict cost controls and you’re on the way to profitability you may never have imagined.
This margin pricing strategy is built into Sera’s field service management software. Margin and markup often get confused, so let’s put some numbers down to compare them.
Margin Pricing Vs. Markup
 As already discussed, gross margin is Gross Profit divided by Revenue X 100. It shows funds left after paying the cost of goods and services directly related to selling products and services.
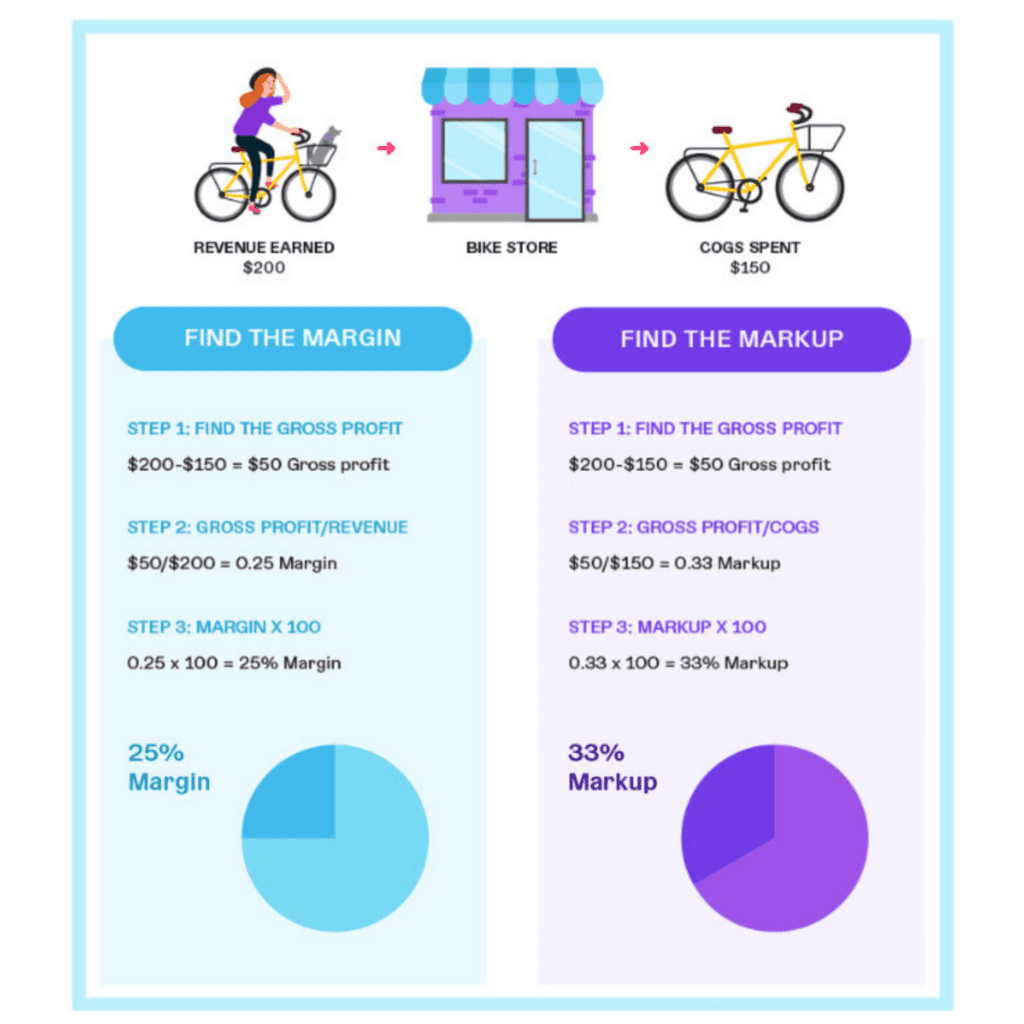
Markup is Gross Profit divided by Cost X 100. Markup shows how much more your selling price is than the amount it costs you to sell goods and services.
This bicycle store illustration from Patriot Software, a payroll and accounting software company, shows that if you have a 33% markup on goods and services, you do not have a 33% gross profit margin; you have a 25% gross margin.
To get to a 33% profit margin you will need to take a bigger markup. But how big? In your algebra is a little rusty, you’re in luck because there is a handy conversion chart for that.
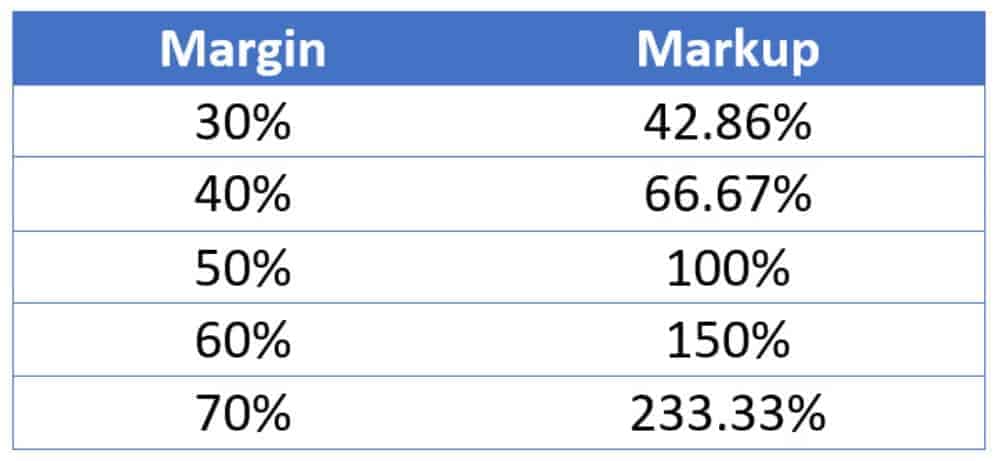 For example, if you wish to have a 50% gross margin on that bicycle you paid $150 for, you need to sell it for $300, a 100% markup. You may or may not be able to do that, depending on market conditions, competition, and your level of customer service.
Our margin vs. markup chart is a representative example. Calculator Soup has a markup calculator
You can use it free of charge so you can try some calculations yourself. That’s OK for understanding the concept but it’s impractical when it comes to calculating every item listed in your price book.
Fortunately, Sera also figures out a margin pricing strategy for you and populates all price data throughout your system automatically, in seconds – every time you adjust prices.
A Closer to Home Example
Now, apply that thinking to everything you sell – HVAC systems, water heaters, garage door openers, parts, and tech labor. These all are costs of goods sold and you need to mark them up to ensure a gross margin that provides operating funds and allows for a healthy net profit after paying indirect costs.
Let’s say the total labor cost for techs is $75 per hour, including hourly rate, vacation, holidays, personal days, health insurance, retirement fund, training, and anything else you may provide. If you mark that up 50% you will be charging $112.50 per hour for the tech’s time, which will equate to a gross margin of 33%.
If your target is a 50% gross profit margin you will mark up the tech’s $75 hourly cost 100% and charge $150 per hour. Remember, when you figure gross profits you still have SG&A, interest expenses, and taxes to subtract before you start counting your money.
That brings into focus the importance of knowing how to set realistic prices. To do that, you must know your costs very well. We will discuss administrative costs from rent and utilities to marketing programs in another article but there is one we need to look at now – tech labor.
Knowing and Controlling Labor Costs
 In simplest terms, improving profit margins for service businesses is a matter of increasing revenue, reducing costs, or both. Labor is the biggest single line item in most HVAC and similar service companies. You cannot set prices that will allow a good profit if you don’t know the actual costs of labor.
You are paying your techs for each hour they work but they aren’t producing revenue every hour. After you subtract calls to make free estimates, callbacks, travel time, stops for fuel, restocking their trucks, and completing paperwork, most techs bill less than half their total hours.
To calculate overall tech efficiency, divide the number of billable hours – time spent working on customer premises – by the total hours worked. If a tech bills 2.5 hours in an eight-hour day the efficiency rate, or utilization rate, would be 30%.
In the field service industry, a 30% efficiency rate is considered good, while a 50% efficiency rate would be outstanding. When you are planning and forecasting use the lower number, then shoot for 50% and higher.
Remember the part about increasing revenue, reducing expenses, or both? Increasing overall tech efficiency from 30% to 50% will slash overhead expenses and vastly improve profit margins – and that is before even considering efficiency improvements you can make in the office.
Don’t Settle for an Outstanding Profit Margin – Go for an Extraordinary
It may surprise you to learn that efficiency rates such as those are laughable to companies that use Sera field service management software.
When we started developing the software, we also started from scratch a new plumbing and HVAC company called billyGO. This company is a working laboratory where we field test software and get instant feedback from techs and office staff about what is working and what isn’t.
billyGO consistently operates at 95% to 105% percent efficiency in the field (see billyGO Admin Portal screenshots below). So do other companies using Sera. So can your company.
Tracking Efficiency of Each Job Performed
Whether you are billing hourly or flat rate, you should track the efficiency of each job performed. We do this by tracking drive time and on-premises billable time, the two factors common to every job. As previously mentioned, there are others but none as big as these.
Sera Systems field service software Job Time Tracker tracks each job with a few screen taps by the techs. The example shown below is for a job performed by a billyGO tech.
The job ticket shows that this particular job was performed at 83% efficiency. The allotted time for this task was 1 hour, 30 minutes. Counting driving and time on-premises, the tech finished the job in 1 hour, 48 minutes.
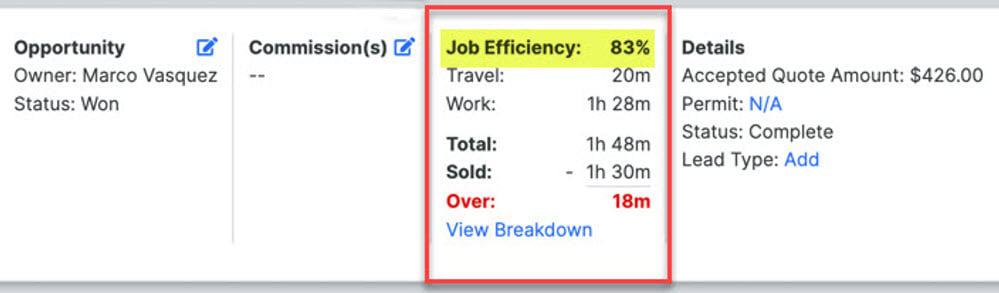
Sera divides the sold time (90 minutes) by the actual time (108 minutes) for a job efficiency of 83%. On a week-to-week basis, billyGO plumbing and HVAC techs operate in a range of 95% – 105% efficiency for all jobs performed.
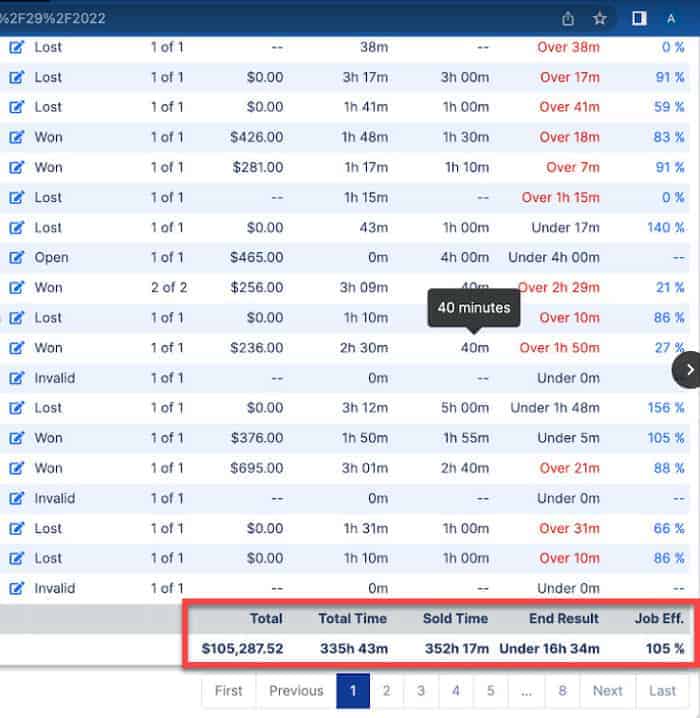 Sera’s Efficiency Evaluator provides an aggregate view of all jobs for a specified period to let you know which jobs were profitable and which were not.
Having this kind of data will have a major impact on your efficiency and profitability. If you see times for certain types of jobs running long or short consistently, data from the Sera Admin Portal will enable you to adjust allocated times and establish profitable pricing.
The Job Time Tracker shows each tech’s efficiency. Complementing that is the Tech Leaderboard, which shows the overall performance effectiveness of individual techs by department, based on factors including revenue, jobs sold, closing rate, and average ticket size.
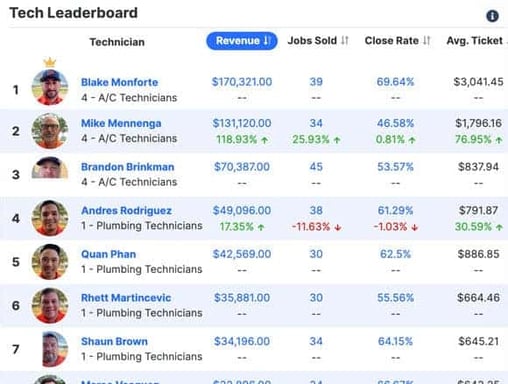 This gives management a constantly updated dashboard view on the Admin Portal to pass out praise and work on areas that need improvement.
Making it visible on the Tech App makes for some friendly competition that benefits everyone. You also will get some useful insights regarding how to help techs improve their performance.
Margins Vary by Department
When considering growth and expansion plans keep in mind the overhead differences in the types of work techs do. Service work is less efficient than installation and replacement work for all the reasons mentioned above.
Installation work is much more efficient by its nature – techs stay in one customer location for hours at a time, with far less travel and administrative work.
If you don’t know your costs for each type of technician work, you cannot forecast accurately or improve efficiency. Many owners find their installations and replacements are profitable, but they are losing money on service.
Labor costs are the biggest single line item in most HVAC and other field service businesses. That means that hiring the right people is one of the most consequential things you can do. The right people make money for you; the wrong people come at a cost.
Conclusion
Although healthy gross and net profit margins are essential to business viability and long-term success, HVAC industry consultants say too few residential HVAC business owners have solid business knowledge.
Because of this, about 5% of US HVAC businesses account for 95% of the profits industry-wide. The key to greater profitability lies in a company’s Profit & Loss Statement because it lists revenue against expenses to show if it is profitable or losing money.
Knowing how to price products and services requires a complete understanding of all costs. Then, using a margin pricing strategy instead of time & material or marked-up flat-rate methods, you can determine appropriate pricing to achieve a desired net profit margin and position the company for year-over-year growth.
A new generation of field service software, developed by Sera Systems, guides business owners and managers through processes that reduce overhead and boost operational efficiency to produce much higher field service profit margins.
